Welcome to the Basic Course for empower® Charts for PowerPoint! In this course, you’ll learn the essential features to create professional, brand-compliant charts with ease. Discover how to streamline your workflow with intuitive charting tools, automation, and efficient data visualization. Get started with empower® Charts for PowerPoint and enhance your presentations effortlessly!
Course Content
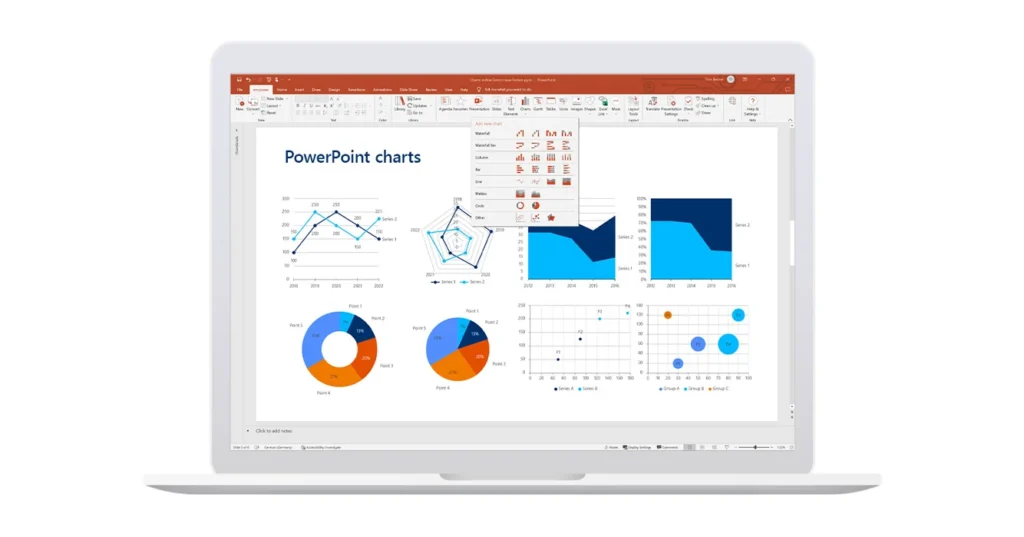
empower Charting for PowerPoint: Basic Course
empower® Chart Creation – Supercharge productivity creating powerful presentations
You don't currently have access to this content
Overview – Charting with empower®
You don't currently have access to this content
Line Charts – Charting with empower®
You don't currently have access to this content
Arrows and Lines – Charting with empower®
You don't currently have access to this content
Formatting – Charting with empower®
You don't currently have access to this content
Data Labels – Charting with empower®
You don't currently have access to this content
Properties and Legends – Charting with empower®
You don't currently have access to this content
Mini-Excel and Data Menu – Charting with empower®
You don't currently have access to this content
Gantt Charts – Charting with empower®
You don't currently have access to this content
Pie and Doughnut Charts – Charting with empower
You don't currently have access to this content
Bubble and Scatter Charts – Charting with empower®
You don't currently have access to this content
Customizings & Settings – Charting with empower®
You don't currently have access to this content